How Micro-Neighborhood Data Shapes Your List Price in Pinecrest and Kendall

How Micro-Neighborhood Data Shapes Your List Price in Pinecrest and Kendall
Pinecrest Kendall home pricing decisions should never start with a single ZIP-level average. In my practice with The Opes Group at Compass, I answer the “what is my home really worth?” question with micro-neighborhood data, not ZIP code averages—because that is what actually predicts buyer behavior in 33156 and 33176.
If you are preparing to sell, this guide walks through the same framework my team uses: why broad comps mislead, how Pinecrest splits into distinct pockets north and south of the divide, how Kendall’s submarkets create different urgency levels, and what documents and context to assemble before you commit to a number.
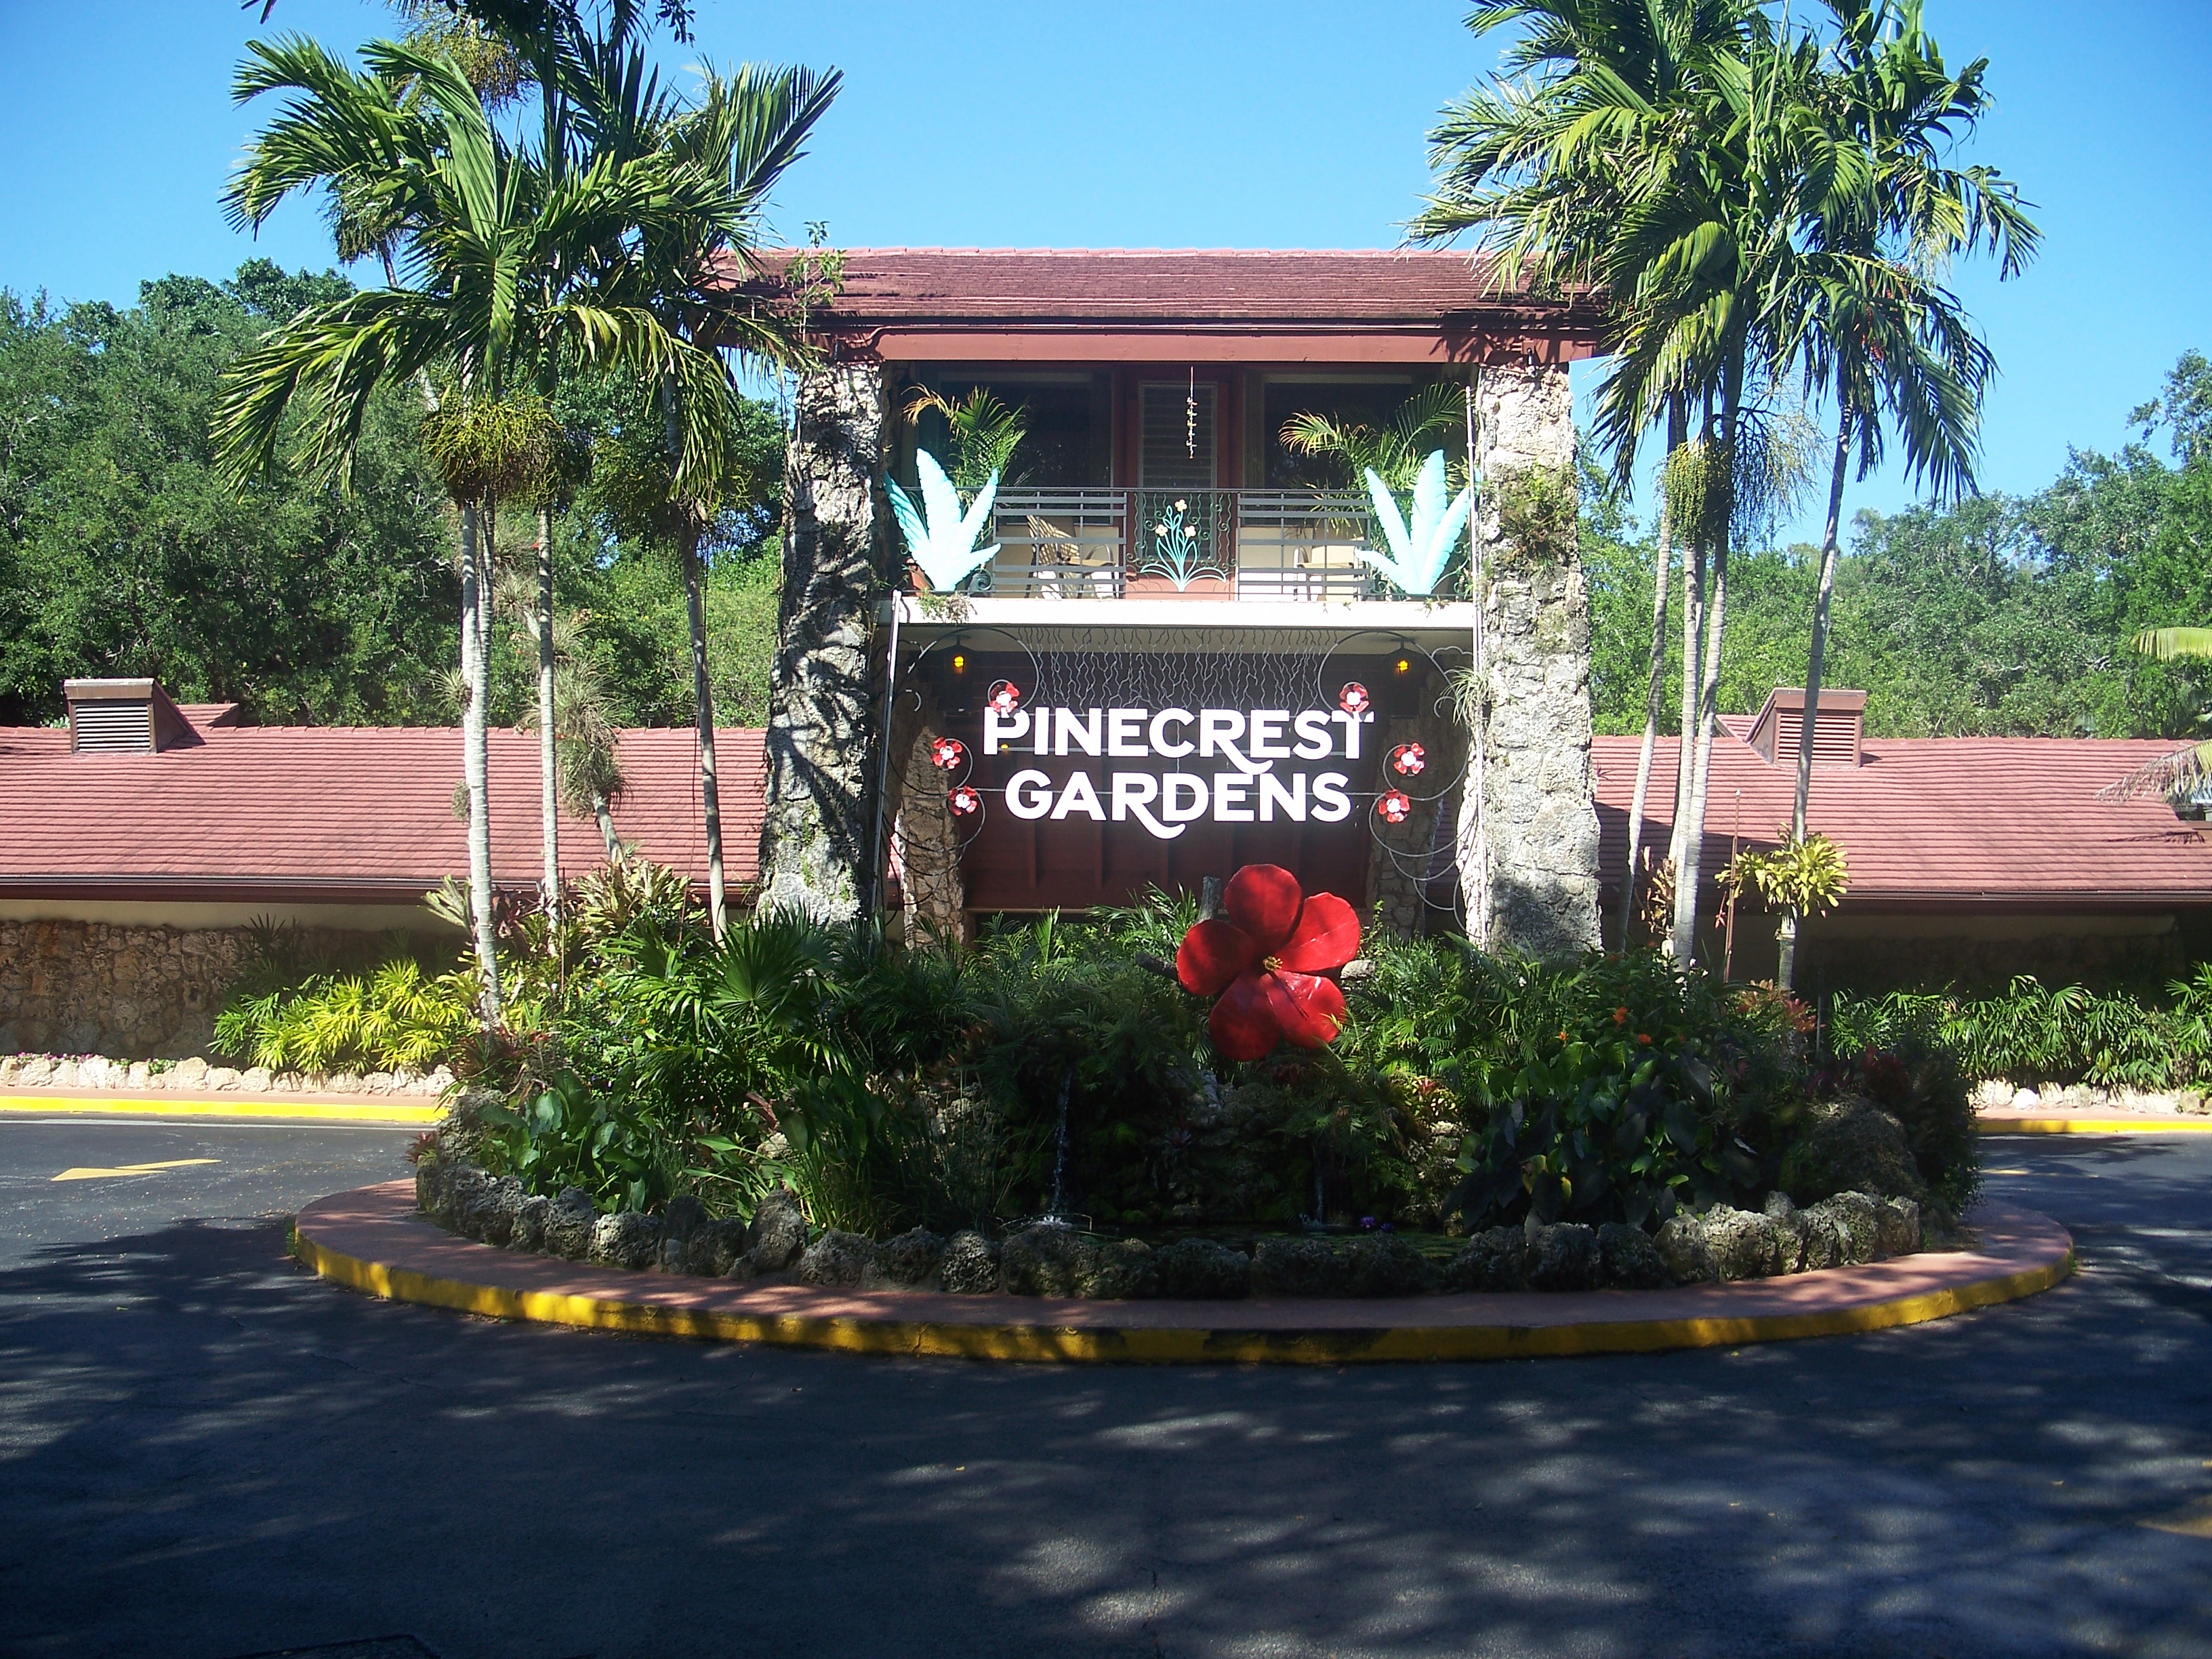
Caption: Pinecrest Gardens anchors buyer interest in North Pinecrest—one of many landmarks buyers mentally map before they ever click on a listing.
Photo: Ebyabe / CC BY-SA 3.0

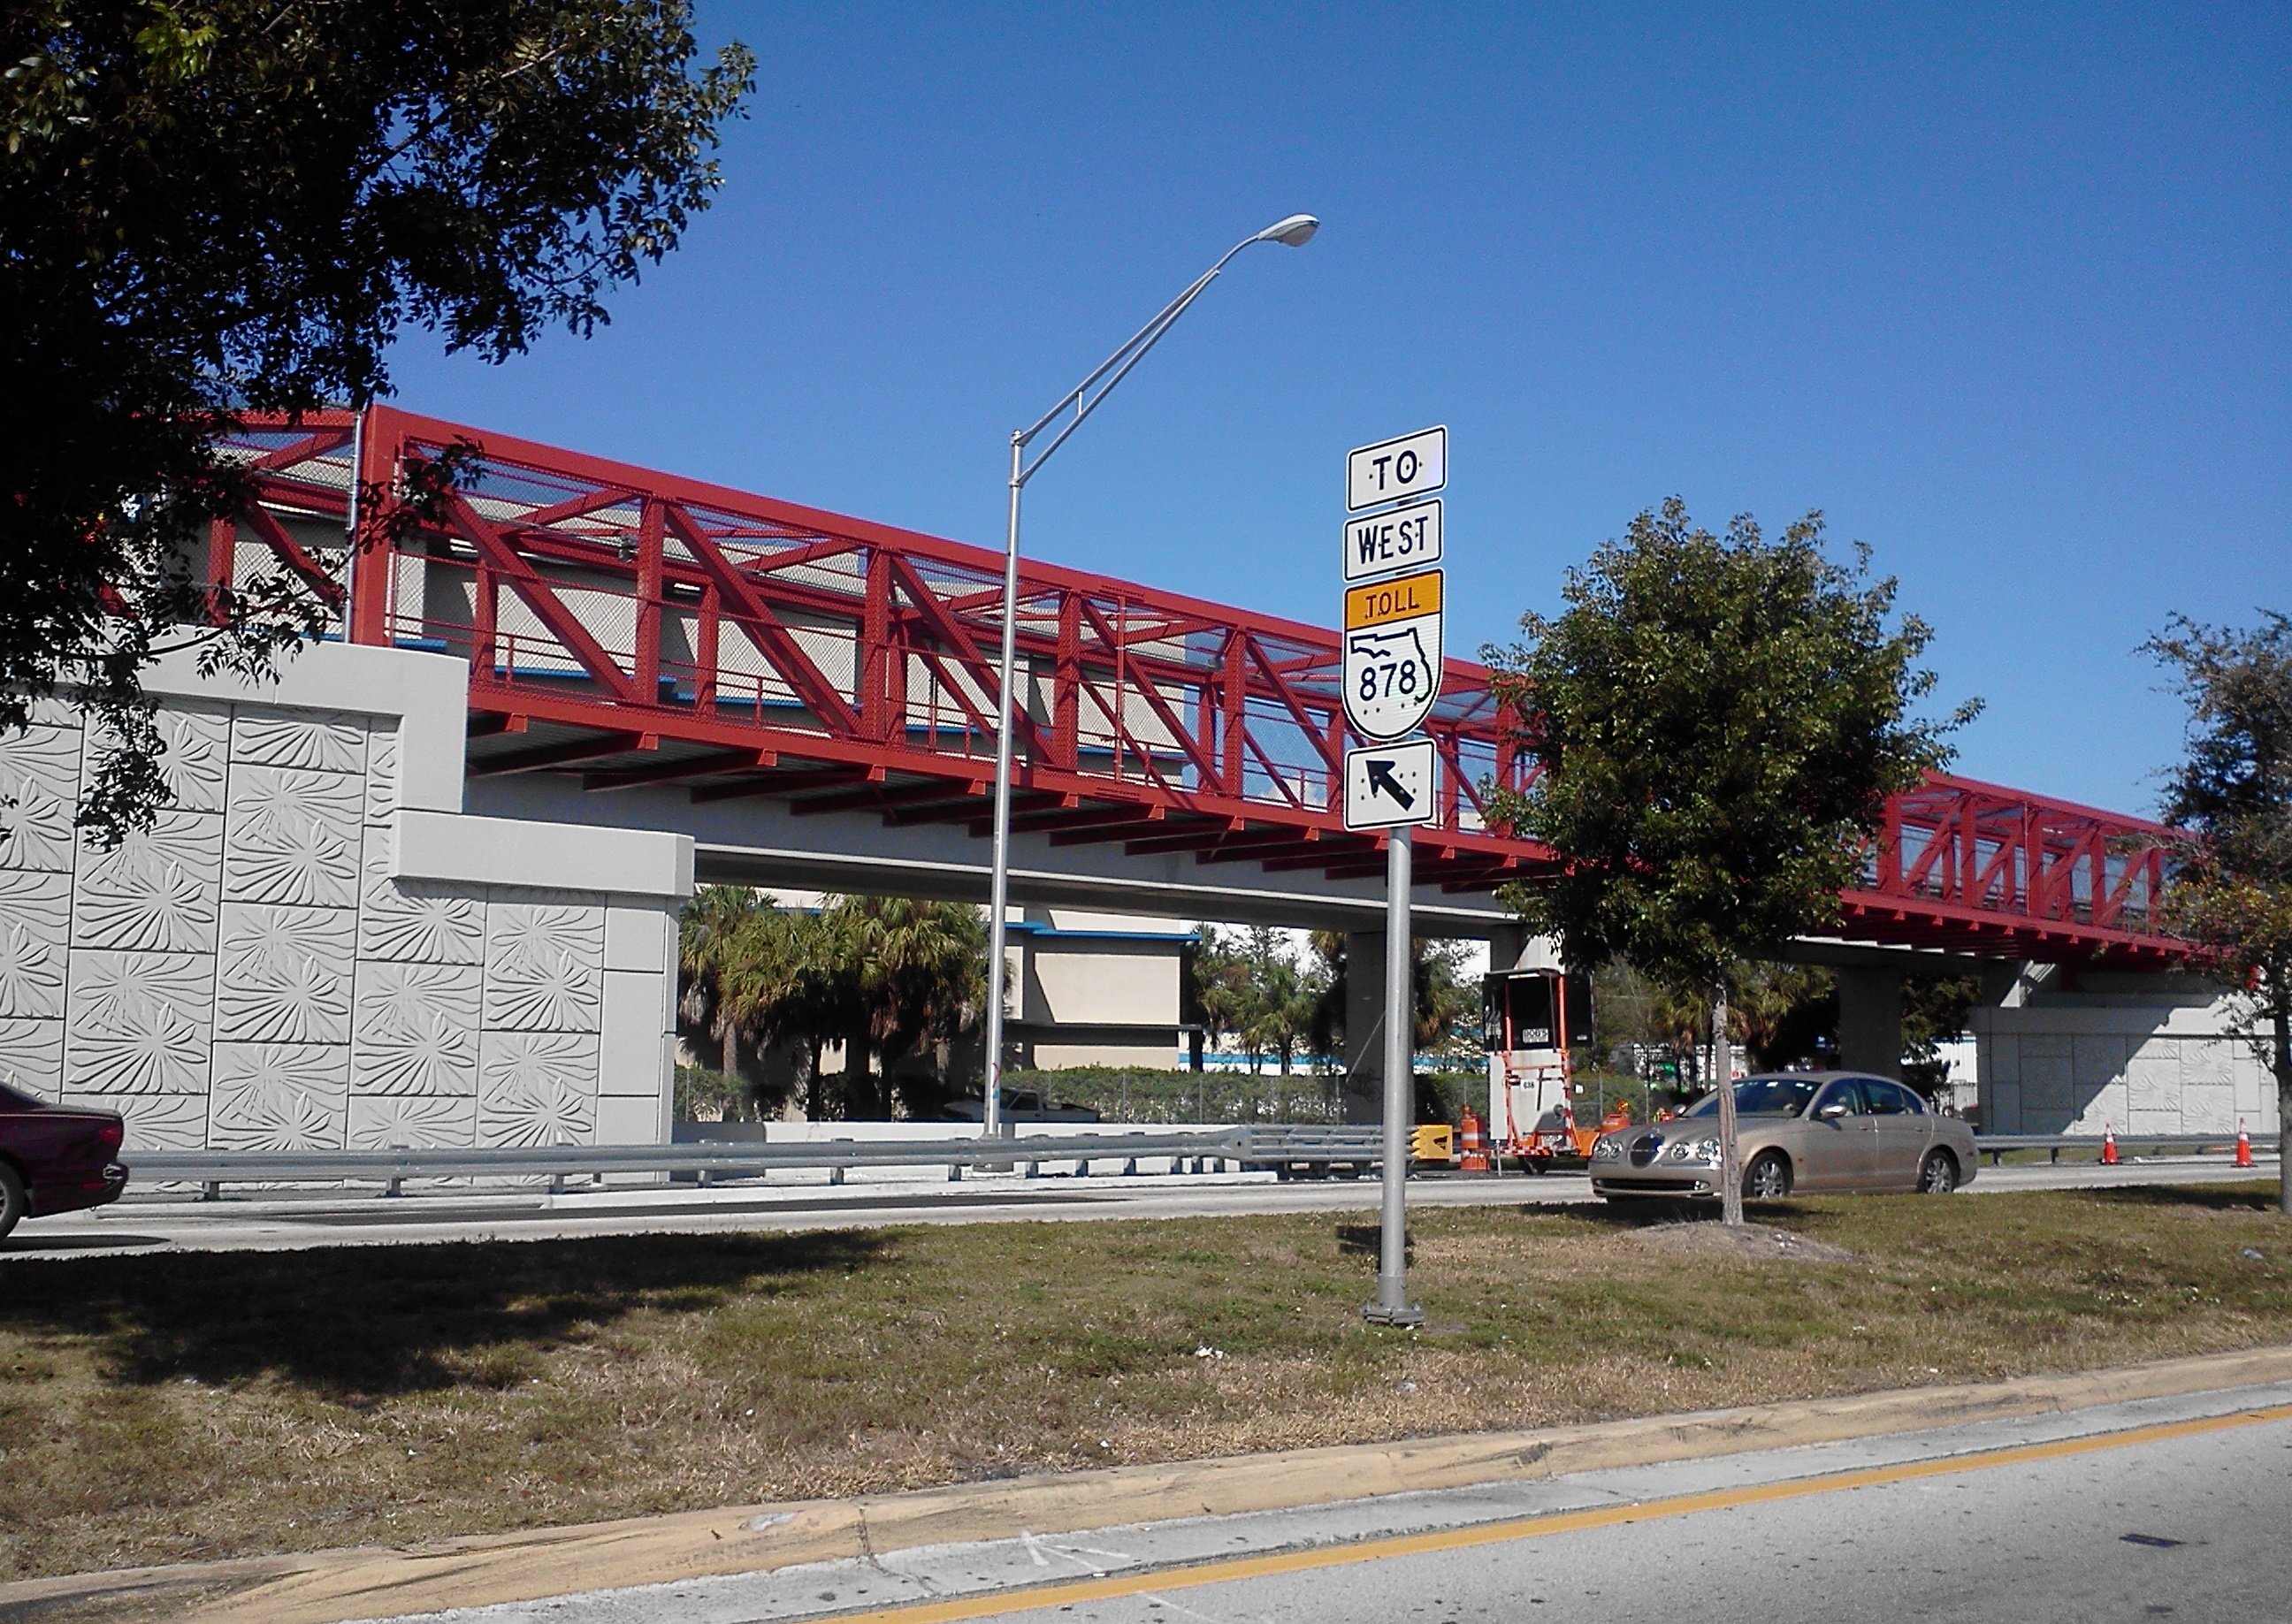
Caption: Kendall’s Dadeland corridor illustrates how commute patterns and retail access shape what buyers will pay—often more than the phrase “Kendall average” captures.
Photo: Marc Averette / CC BY-SA 3.0
Why ZIP-Level Comps Can Mislead Pinecrest and Kendall Sellers
A ZIP code is a mailing boundary—not a pricing thesis. On my homepage, I emphasize the difference between generic statistics and the street-by-street reality sellers feel once showings begin: $500M+ in career sales, a 98% list-to-sale price ratio, and listings that average 30 days on market when pricing and marketing are aligned. Those results come from treating 33156 and 33176 as collections of micro-markets, not monoliths.
When sellers rely on ZIP-only averages, three problems show up repeatedly:
- Mixed product types get blended—estates, teardown candidates, and renovated homes share a denominator that does not reflect your buyer pool.
- Location premiums disappear—school proximity, traffic patterns, and adjacency to parks or commercial corridors move numbers block by block.
- Strategy drifts—you either chase the market with reductions or leave money on the table because the initial story never matched the comps that should have anchored the list price.
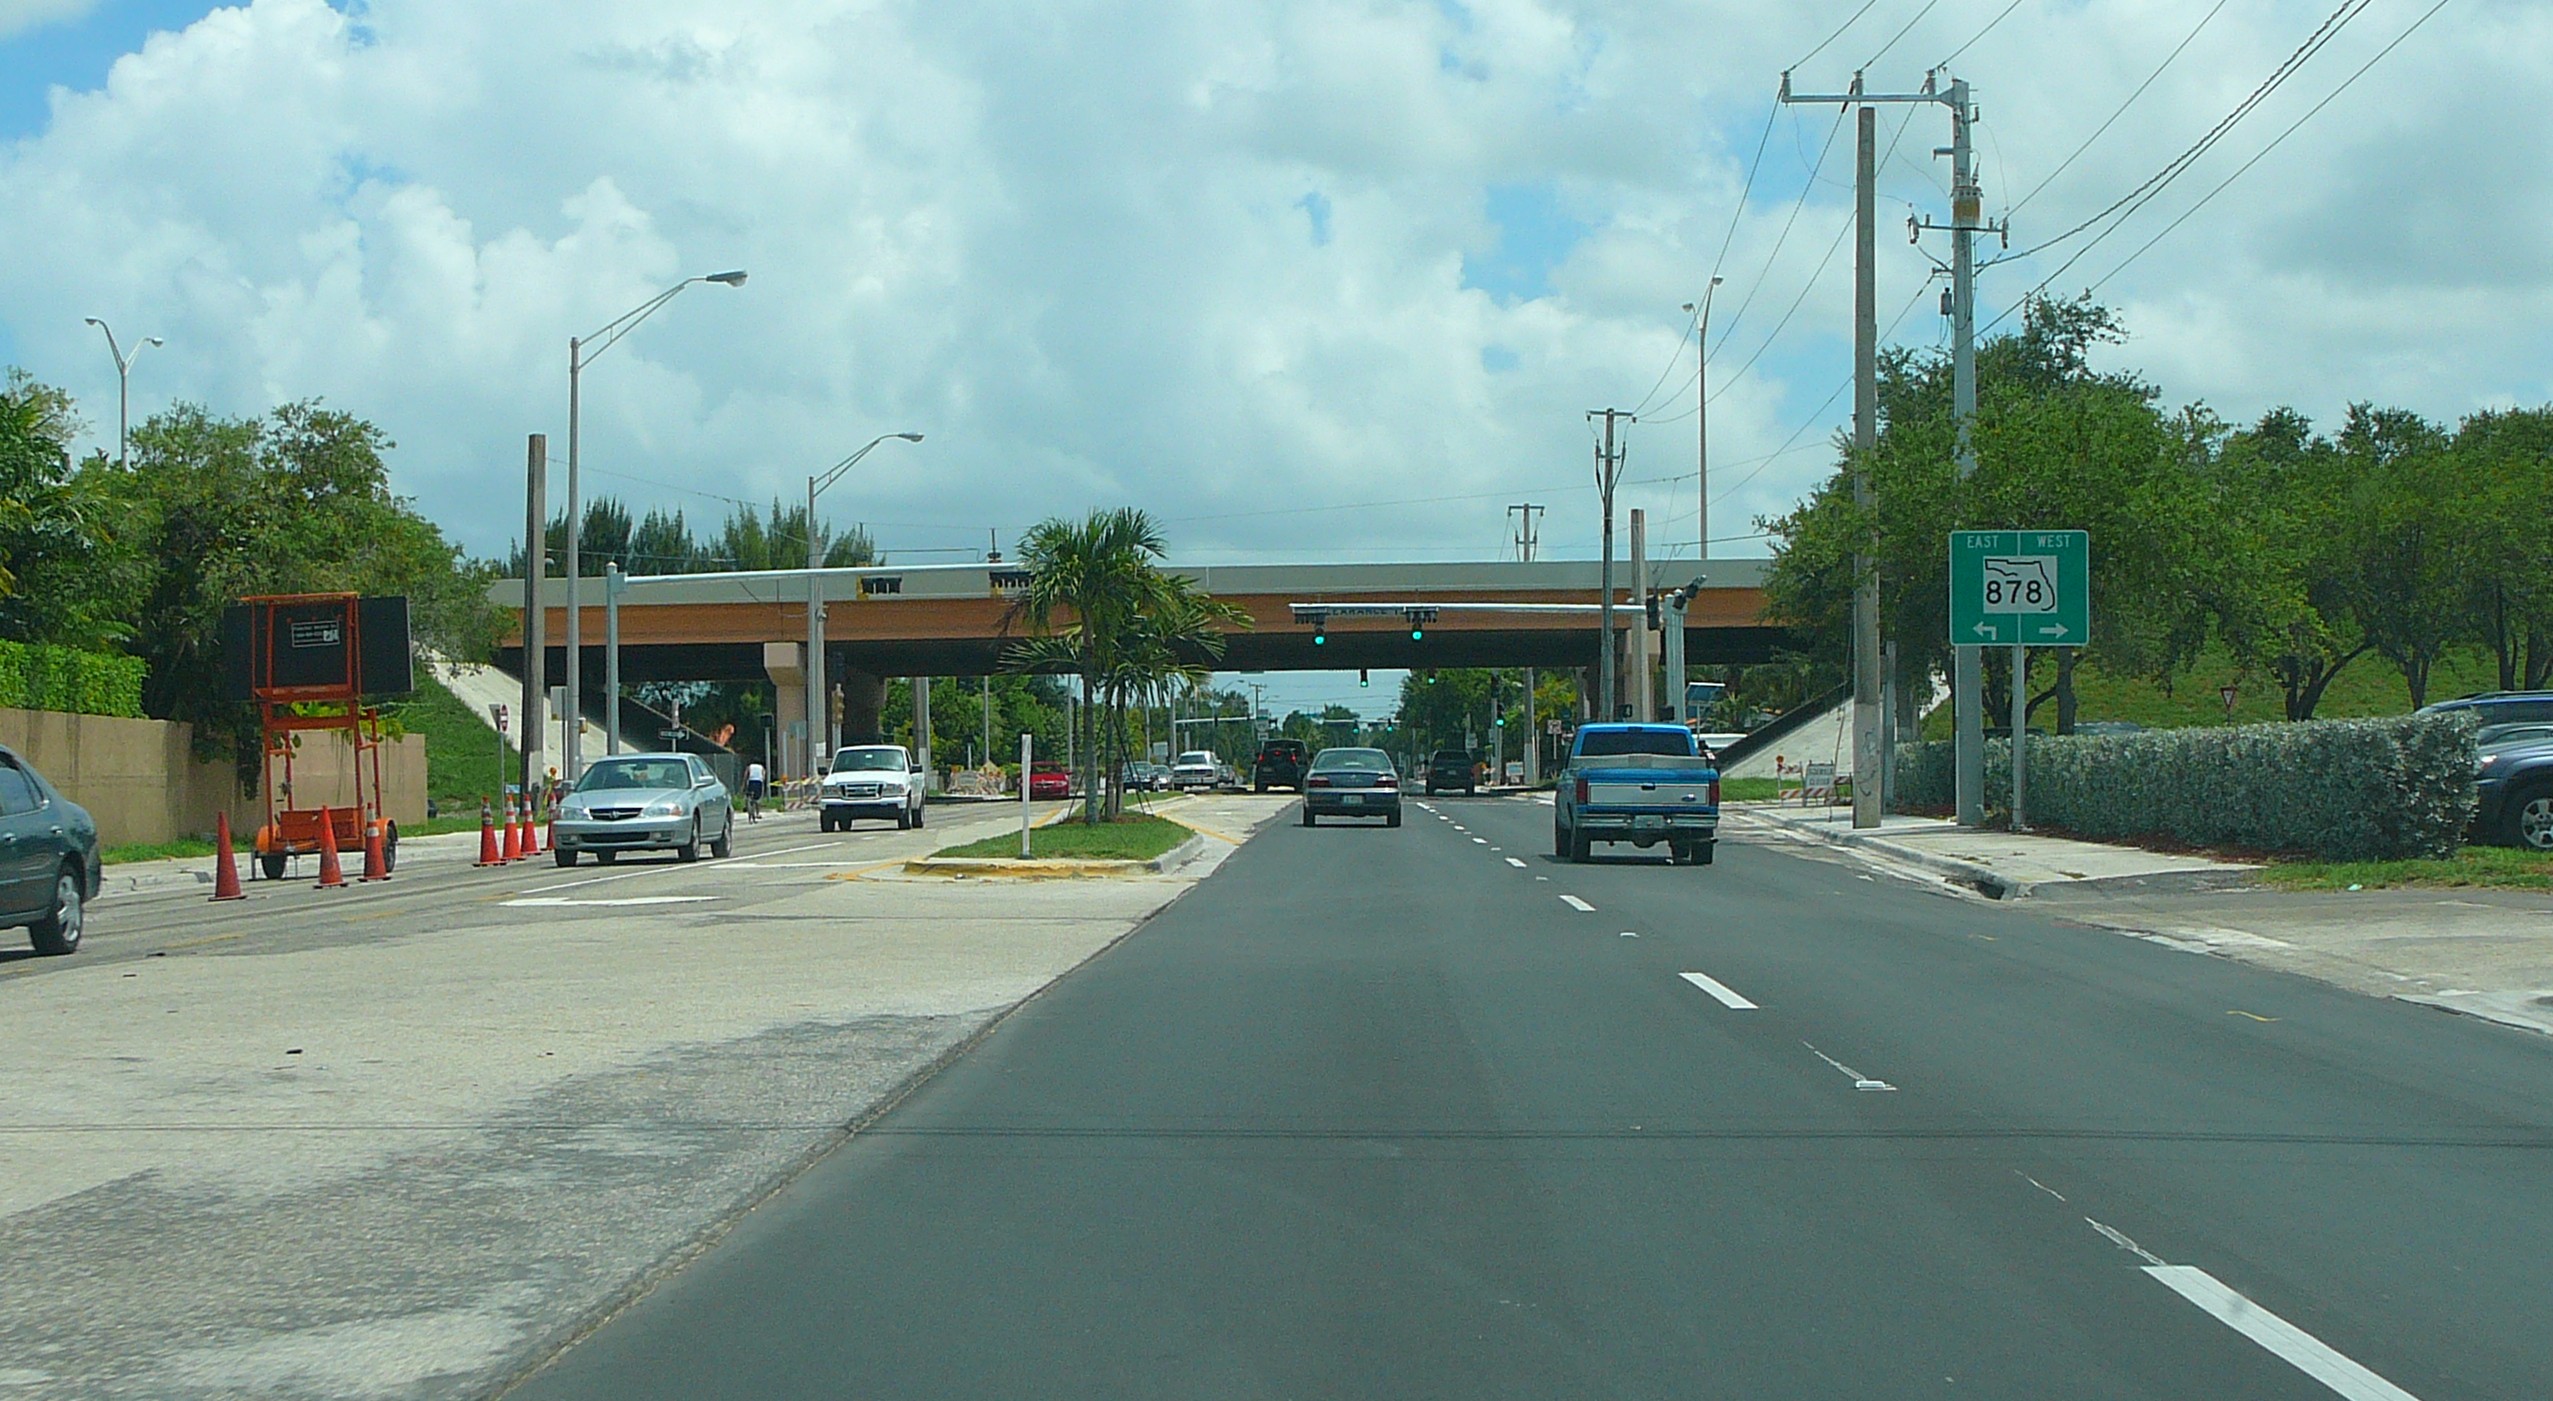
Caption: Major corridors like Galloway Road split buyer pools block by block—exactly the kind of detail a ZIP average flattens away.
Photo: Marc Averette / CC BY 3.0
For a deeper library of neighborhood-specific breakdowns, start on my Insights hub and bookmark the guides that match your property type.
Pinecrest: How North, South, East, and West Behave Differently
Pinecrest is a perfect example of “one ZIP, many markets.” In my North vs South Pinecrest pricing guide, I make the case directly: Pinecrest may be one ZIP code (33156), but it is several distinct micro-markets with significantly different pricing dynamics. The article also notes the practical boundary many locals use: SW 104th Street (Killian Drive), with North Pinecrest including areas around Pinecrest Gardens and Gulliver Schools.
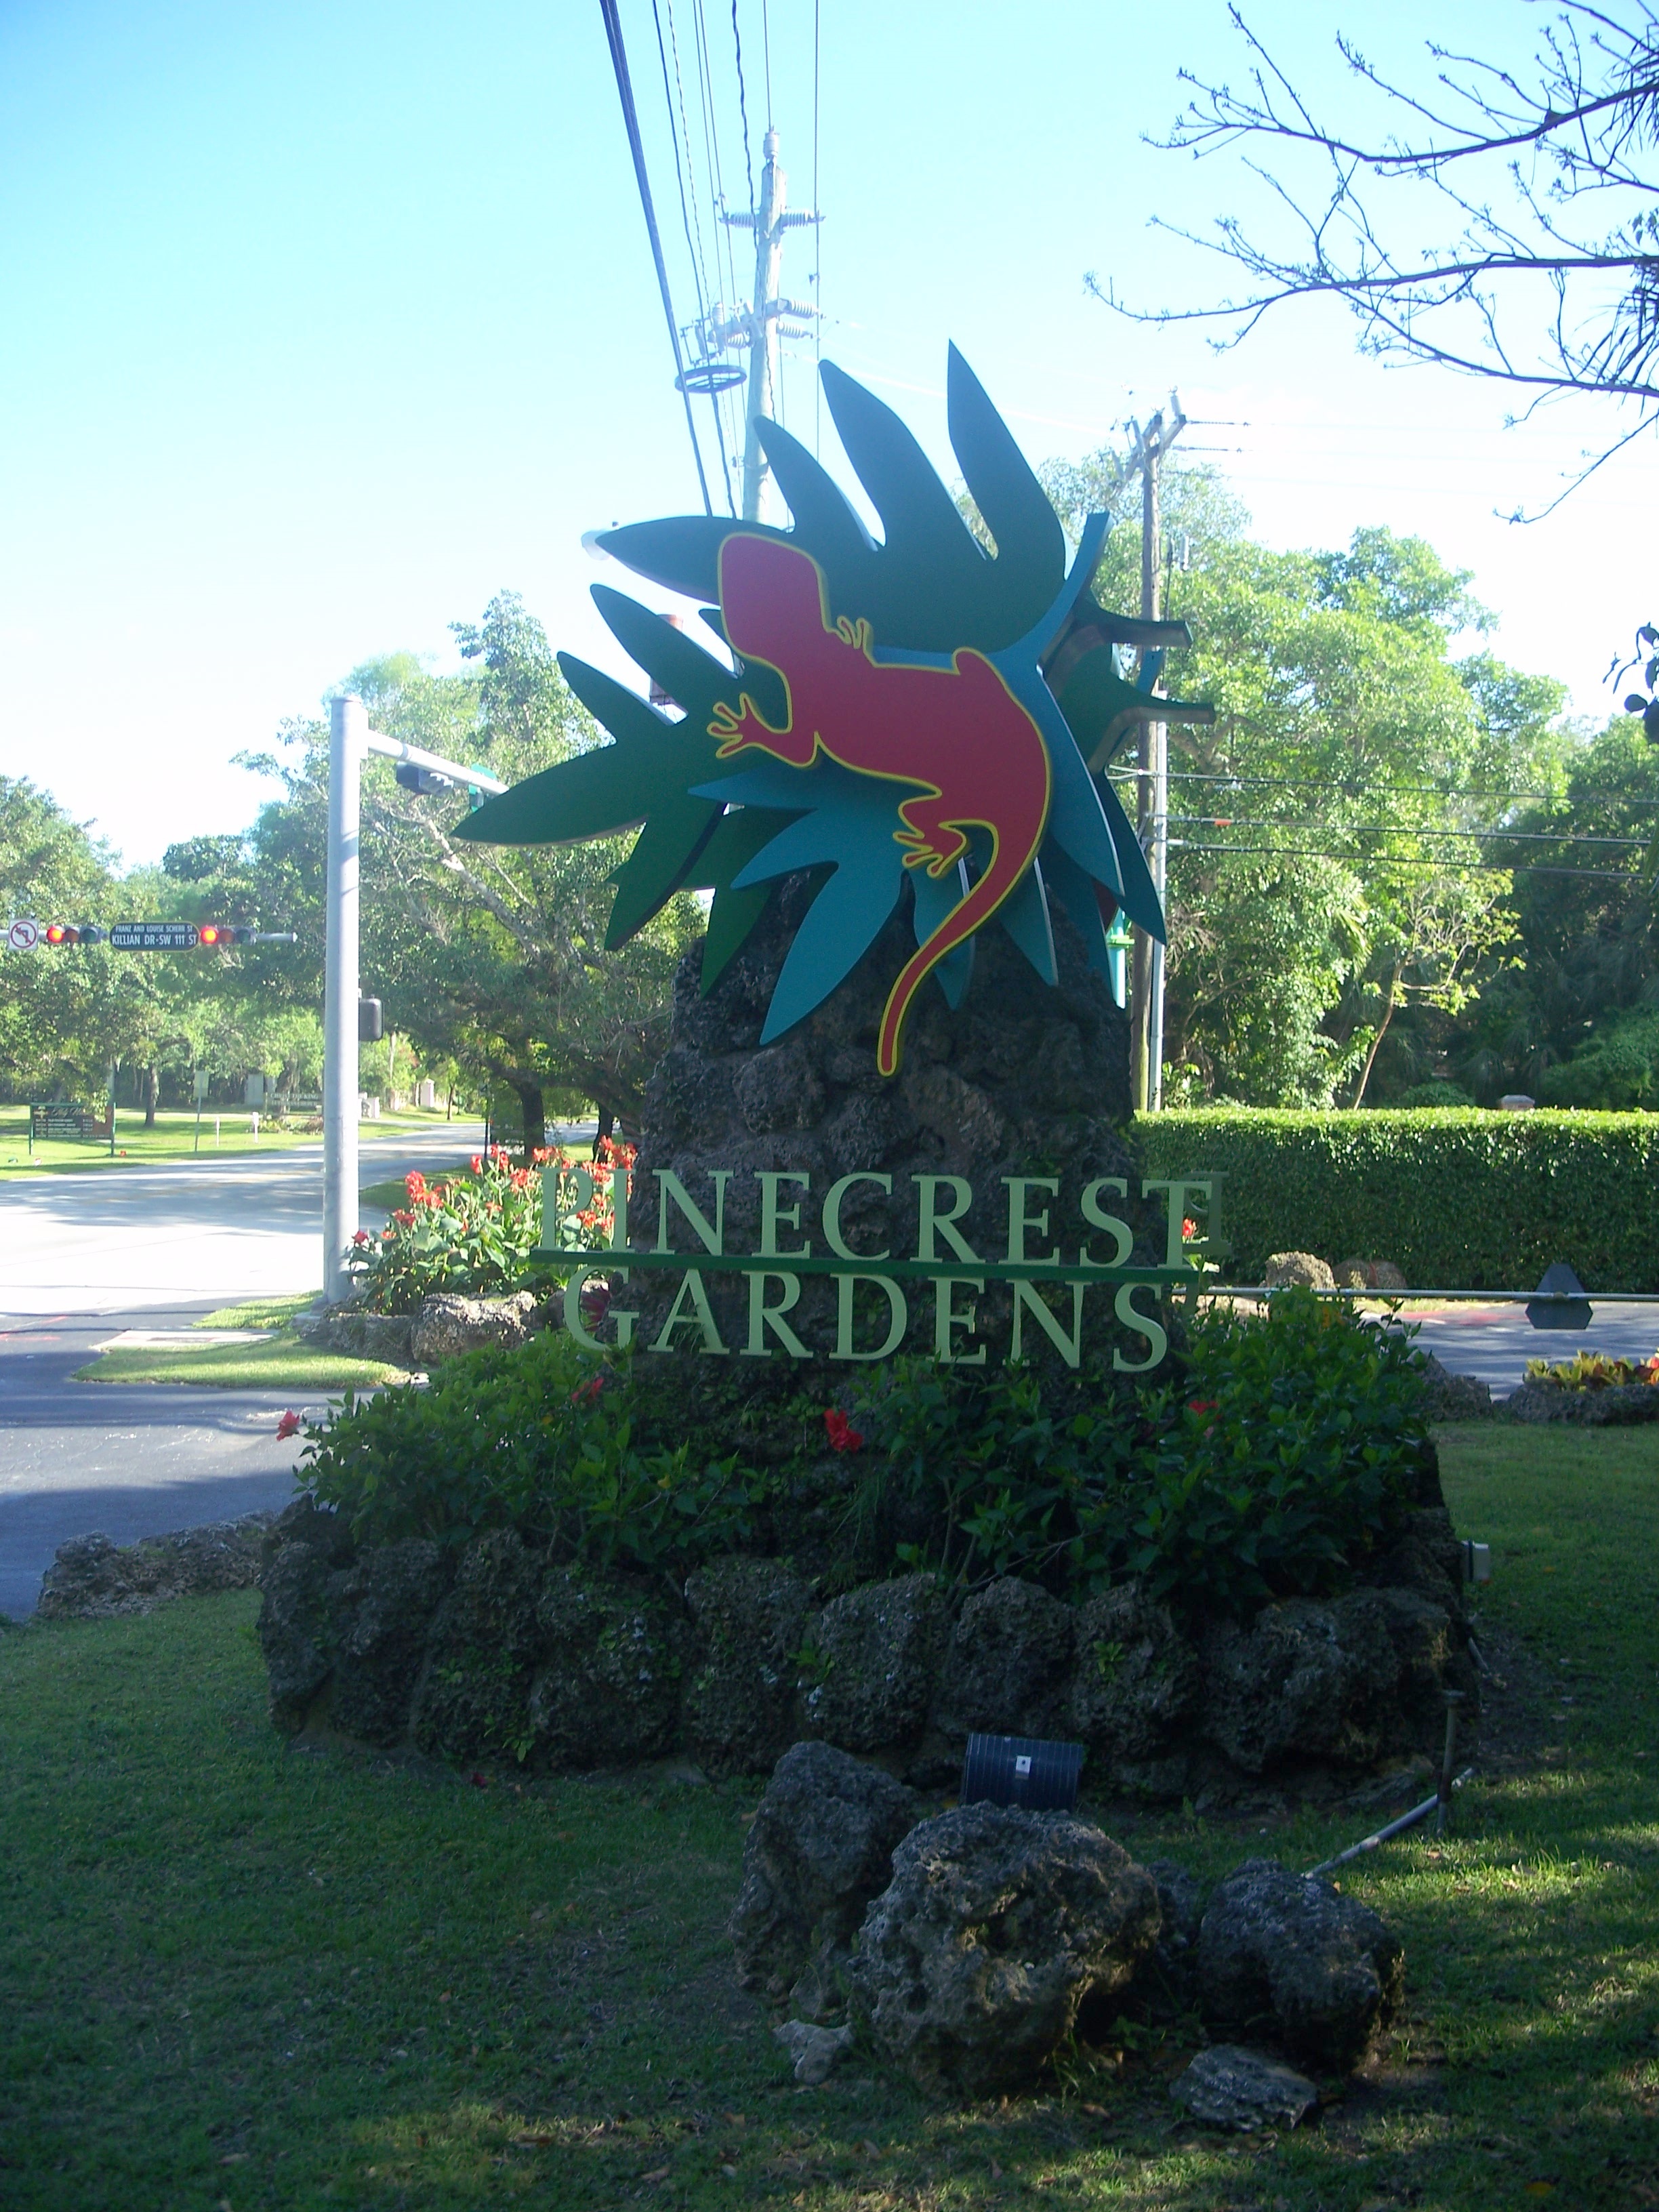
Caption: Landmarks like Pinecrest Gardens help buyers and appraisers agree on which Pinecrest story your home belongs in before anyone debates price per square foot.
Photo: Ebyabe / CC BY-SA 3.0
That same guide includes current overview bands I use in client conversations—North Pinecrest with an average home price of $3.2M–$4.5M, and South Pinecrest with an average home price of $1.8M–$2.8M. Those ranges are not interchangeable; pricing South Pinecrest using North Pinecrest comps is one of the most expensive mistakes I see.
East and West Pinecrest add another layer. On my About page, I describe how East Pinecrest’s walkability to US-1 amenities appeals to professionals, while West Pinecrest’s privacy and larger parcels attract buyers who want a quieter envelope. Your list price should reflect which buyer profile your floor plan, lot, and micro-location actually attract—not which comp is easiest to find on a portal.
Timing expectations should move with the micro-market, too. In my North vs South guide, the overview bands include days on market of 48–55 for many well-priced North Pinecrest listings, compared with 35–42 days for well-priced South Pinecrest listings—another signal that buyers are not reacting to “Pinecrest” as a single speedometer. If your home is priced like an estate corridor product but shows like an entry Pinecrest lifestyle buy, you will feel that mismatch in showing volume long before you see it in a spreadsheet.
One mistake I call out explicitly in that same guide is pricing South Pinecrest using North Pinecrest comparables—it tends to create a long runway of days on market and eventual reductions. The fix is not “pick lower comps”; it is pick the right comps, then defend the number with condition, lot story, and the buyer profile you are intentionally targeting.
Kendall (33176): Micro-Markets and Buyer Urgency
Kendall is not “more affordable Pinecrest”—it is a parallel market with its own leaders and laggards by sub-neighborhood. In my Kendall market trends analysis, I outline a late 2025 / early 2026 snapshot sellers can use as a baseline: median sale price of $850,000 (up 8% year-over-year), 38 days on market for properly priced homes, and a 97.2% list-to-sale ratio.
Caption: The Snapper Creek corridor behaves like its own market—buyers who compare you to other gated and waterfront-adjacent pockets are not thinking “median Kendall.”
Photo: Daniel Christensen / CC BY-SA 3.0
That piece also explains why certain pockets move faster—and the numbers make the point concrete. In the neighborhood-by-neighborhood section of my Kendall trends guide, Snapper Creek shows an average around $2.1 million with 58 days on market, reflecting a luxury buyer who compares you to other gated, waterfront-adjacent options. Killian sits near a $750,000 average with 32 days on market, where well-priced family homes can move quickly when schools and neighborhood character line up with expectations. Devon Aire lands near a $650,000 average with 36 days on market, often tied to entry-level Kendall and golf-community buyers who are financing-sensitive and presentation-sensitive at the same time.
Baptist Area is the urgency outlier in that same analysis: an average near $725,000 with 28 days on market, driven by healthcare professionals and investors who prize short commutes and predictable rental demand. If your home is functionally a Baptist Area product but you benchmark only against a Kendall-wide median, you can accidentally mute the very urgency buyers feel in that pocket—or, conversely, you can price for “hospital proximity energy” when your showing feedback is coming from a completely different buyer pool.
This is why 33176 rewards the same discipline as 33156: name the submarket first, then build the comp set, then align preparation and marketing with the buyer who already shops that submarket weekly.
What to Assemble Before You Choose a List Price
On my About and Sell pages, I emphasize micro-neighborhood pricing, premium marketing, and a full-service team of 20+ professionals so sellers are not juggling vendors at the moment negotiations matter most. Before you lock a number, pull together:
- A tight comp set drawn from your micro-neighborhood—not random closings across the ZIP.
- An honest condition narrative aligned with what Pinecrest and Kendall buyers expect at your price point (impact protection, kitchens, outdoor living, and maintenance items show up constantly in showing feedback).
- Lot and privacy story where relevant, especially in North Pinecrest and gated Kendall pockets where land value drives a disproportionate share of offers.
- Timing context for your buyer type: families, healthcare professionals, investors, and relocation buyers do not always peak in the same 30-day window.
If you are debating pre-listing improvements, my sell page outlines how Compass Concierge can front costs for painting, staging, landscaping, and repairs with no upfront payment, with repayment at closing only if the improvements support the sale. The goal is not to “spend your way” to a number—it is to remove the objections buyers use when they compare your home to tighter micro-neighborhood comps.
Finally, bring showing feedback discipline: in Kendall especially, buyers may weigh insurance and storm-hardening realities alongside price. In Pinecrest, lot and privacy narratives often show up in second showings, not first clicks. Your pricing strategy should anticipate the second visit, because that is where micro-location and condition either reinforce the list price—or contradict it.
If you want a concise snapshot of how I present this to sellers day to day, my sell page spells out the micro-neighborhood promise explicitly and shows how Pinecrest and Kendall cards differ—Pinecrest at $2.8M average with 45 days on market versus Kendall at $850K average with 38 days on market in the on-page neighborhood summaries.
Next Step: A Consultation Grounded in Micro-Neighborhood Data
When you are ready to translate this framework into a seller plan, schedule a consultation or call (305) 302-6384. I will review micro-neighborhood comps with you, outline preparation priorities, and show how premium marketing and negotiation support the list price we choose together—so you are not guessing with your equity on the line.
If you are weighing a move within the next quarter, bring your most recent utility, insurance, and HOA documents to our first meeting. Those details rarely change the “headline” price buyers see online, but they frequently change how confidently a serious buyer writes an offer—and in Pinecrest and Kendall, confidence is what converts showings into signed contracts.
For more seller-focused analysis, keep browsing Market Insights and share this article with a neighbor who is still pricing off a ZIP average alone.
Related Pinecrest & Kendall Insights
Selling in Pinecrest & Kendall?
Get a free valuation or explore seller services for ZIP 33156 and 33176.